Version 2.4
LatestVersion 2.4 brings a completely redesigned History experience, better insights for RV and marine systems, smarter alerts, and several fixes that make your daily energy numbers more accurate.
iOS & macOS Everything below applies to iPhone, iPad, and Mac.
New
A completely rebuilt History tab
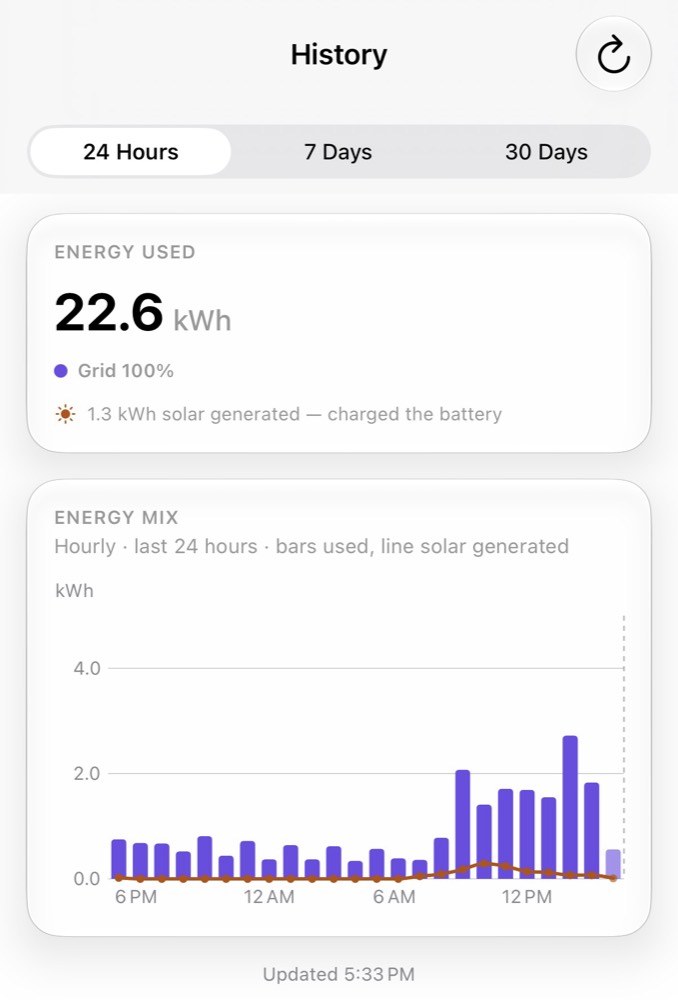
History now gives you one clear view of where your energy came from and where it went.
A new stacked chart shows your mix of grid, battery, and solar together instead of making you switch between separate charts. Solar generation is shown as a line above the chart, while energy sent back to the grid appears below it.
Switch between 24 Hours, 7 Days, and 30 Days without changing how you read the chart, and scrub across any bar to see the exact energy mix for that period. History now opens to the 7-day view by default.
New AC Input Current and Grid Share metrics
We've added two metrics designed around the way RV and marine owners actually think about power:
- AC Input Current shows how many amps you're pulling from shore power. On 50A split-phase systems, we show the busiest leg — the one most likely to reach its breaker limit first.
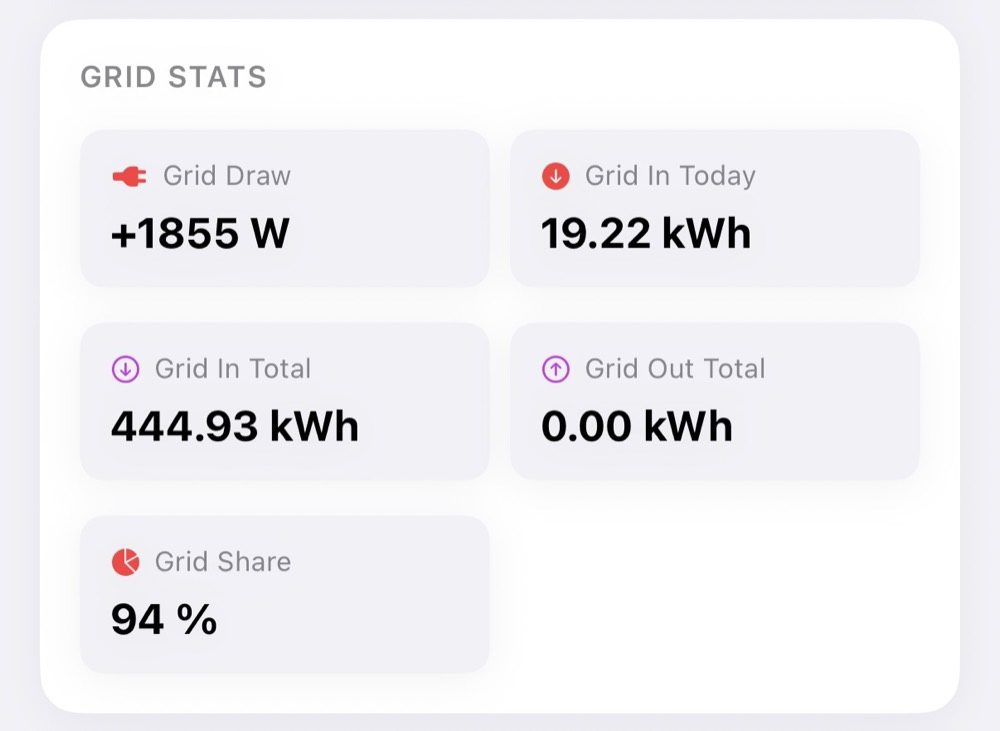
- Grid Share shows what percentage of your energy is coming from shore power versus your own system, giving you a quick way to see how dependent you are on the pedestal.
Know when something isn't right
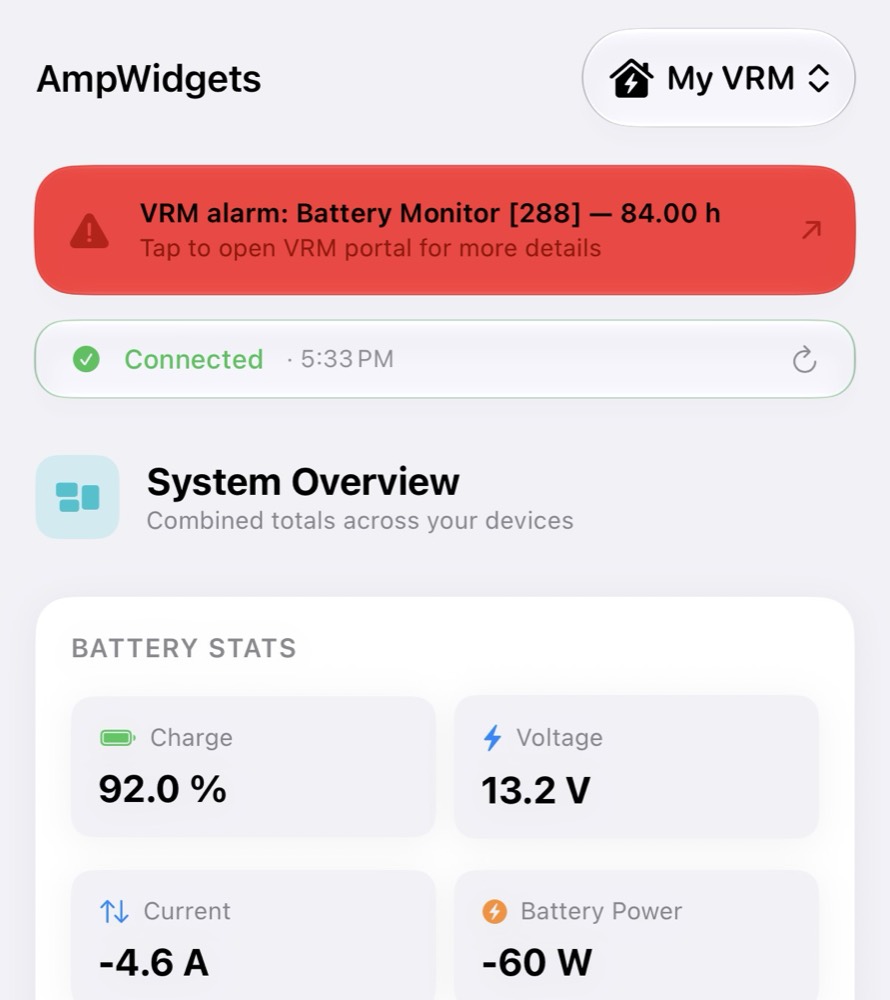
The Dashboard can now surface important system health information directly from VRM.
You'll see a banner when VRM reports an active alarm, when your entire installation stops reporting, or when an individual device goes offline while the rest of your system remains connected. Tap the banner to open VRM for more details.
Setup can now find your installations
Connecting AmpWidgets to VRM is easier. After entering your token, AmpWidgets can now show the installations that token has access to — no more hunting through the VRM portal for a six-digit installation ID.
Manual entry is still available for restricted tokens that can't list installations.
Smarter alerts with fewer false alarms
Alerts can now require a condition to remain active for two, three, or four consecutive checks before notifying you.
That means a single unusual reading doesn't have to trigger an alert — especially useful for values that occasionally spike or dip for a moment.
Fixed
"Grid In Today" wasn't actually showing today
We found that Grid In Today was using the grid meter's lifetime energy counter rather than the amount used that day.
Daily grid usage now comes from the same energy-flow data used by VRM, so "today" really means today.
Your lifetime totals are still available — they're now more clearly named Grid In Total and Grid Out Total.
Deleted installations now stay deleted
Previously, syncing could cause an installation you deleted on one device to reappear later.
Deletions are now synced properly across your devices. Remove an installation on one device and it will disappear from your others too, without needing to relaunch AmpWidgets.
Daily totals now use your installation's timezone
AmpWidgets previously treated midnight on your iPhone, iPad, or Mac as the start of a new day. That's not always the same midnight your VRM installation uses — especially when you're traveling or monitoring a system somewhere else.
Daily totals now follow the installation's timezone, keeping AmpWidgets and VRM in agreement. History will also let you know when your current timezone and your installation's timezone mean you're looking at different definitions of "today."
Solar generation no longer disappears from History
Some DC-coupled solar systems report their energy in a way that can make solar appear to be missing from a load-focused chart — even while you're generating plenty of it.
History now shows solar generation explicitly, giving you a much clearer picture of what your panels produced.
We've also improved how gaps in reporting are displayed. If your system stops sending data for a period of time, the solar line now breaks instead of drawing through the missing period and making it look like data was received.
Also improved
We've made several behind-the-scenes improvements to how AmpWidgets reads and interprets grid and AC input data from VRM.
macOS Specific to the Mac app.
New
System announcements in the menu bar
The AmpWidgets menu bar app can now surface system announcements, making it easier to notice when something changes without opening the full app.
